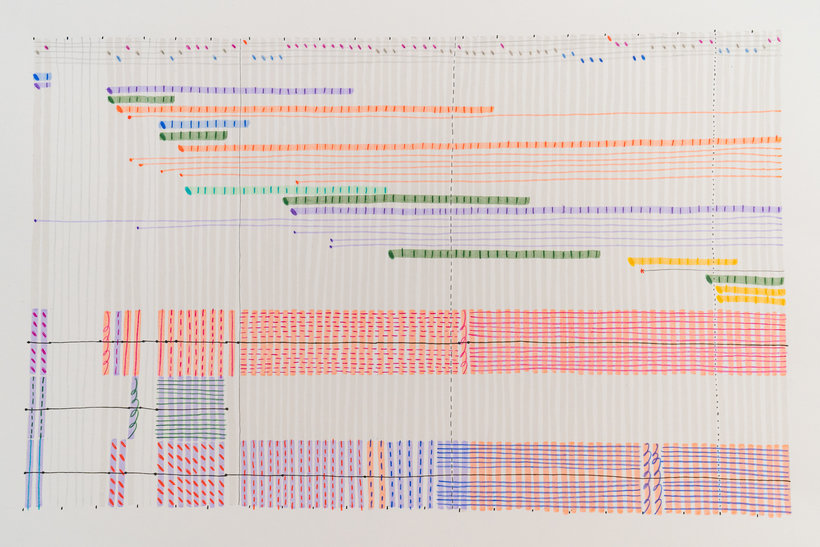
Analog Data Visualization for Storytelling
Course final project
A course by user8940536 surname8940536 , Designer, Artist, and Author
Joined October 2021
Explore the narrative potential of data and learn to create engaging imagery that tells a story using analog materials
About the final project for: Analog Data Visualization for Storytelling
Analog Data Visualization for Storytelling
“Congratulations! You have reached the end of this Domestika course. I hope you had fun exploring the world of data visualization! It's now time to work on your project. This could mean finishing the concept you started by completing the course tasks or making a brand new project! Either way, I strongly suggest you take the time to gather inspiration and make a unique project of your own. Make sure to keep track of your progress with different pictures of each step. It'd be great if you could also explain the choices you've made along the way and tell us if you have any doubts. This will help me understand your creative process and guide you better if you need advice. Here are the main steps to follow: The Story Choose the story from your life you want to tell. Then, think of 3 to 4 questions to answer using data that will best communicate this story. Collect the Data Gather your data, then clean, organise, and analyse it to find your editorial focus and also prepare it for drawing. Create the Layout Determine how the data will be organised on your page (use your editorial focus as your guide)! Create thumbnail sketches to determine your drawing’s underlying architecture.


Partial transcription of the video
“ Final Project Thank you so much for joining me on this course. I hope you'll learn some new things about yourself that you didn't know before. Doing this project has made me realise things that I wouldn't have otherwise. I've got a few final tips for you. Firstly, base your project around a topic from your life that excites you as it'll make you feel more engaged and inspired. Also, remember that a dataset can be collected on any topic, so don't be afraid to experiment. One of the best parts of this project is that we're collecting our own data. We can collect more esoteric, playful datas...”
This transcript is automatically generated, so it may contain mistakes.
Course summary for: Analog Data Visualization for Storytelling
-
Category
Design -
Software
Google Sheets -
Areas
Graphic Design, Infographics, Information Design, Interactive Design

A course by user8940536 surname8940536
Stefanie Posavec is a designer, artist, and author who specializes in data visualization. She studied graphic design at Colorado State University before going on to complete a master's in communication design at Central Saint Martin’s, University of the Arts London. There, for her final project Writing Without Words, she explored ways of visualizing writing styles in literature, which inspired her to pursue a career in book design. After her project went viral, she left her job in publishing to focus on freelance work in the data visualization field.
With over 10 years of experience, Stefanie has worked with clients like the V&A, Wellcome Collection, and National Maritime Museum. She was also Facebook’s first Data Artist in Residence and has received awards for her book project Dear Data. Postcards and sketchbooks from the project are also held in the permanent collection of MoMA, New York.
- 94% positive reviews (51)
- 1,962 students
- 15 lessons (2h 36m)
- 34 additional resources (17 files)
- Online and at your own pace
- Available on the app
- Audio: English
- English · Spanish · Portuguese · German · French · Italian · Polish · Dutch
- Level: Beginner
- Unlimited access forever


